top of page

her data
Empowering and Connecting Women in Data.


Drawing with Data: Reclaiming Joy Through Data Art
Lately, I’ve been creating in Tableau not to analyze—but to draw. I started experimenting with polygons, shapes, and layers, recreating patterns I saw in Bauhaus art or on Pinterest. It became a joyful, unexpected outlet. No KPIs, no dashboards—just creativity.
Now I’m turning it into a weekly practice. Each week, I’ll share an image that inspires me and a Tableau piece I created from it. If you’d like to join me.

Jennifer Dawes
Jun 10, 20252 min read


What a Week! Tableau Conference 2025 Recap
Just back from my 4th Tableau Conference—and first as a Tableau Visionary! From unforgettable moments with data legends to dreaming up spicy ideas like Wings & Tips, I'm recapping the highlights, community connections, and ways we can lift more women in data. Missed the Tip Battle? I’ve got the link. Came to our session? Don’t forget the survey! 🧡 #TC25 #DataFam #WomenInData #TableauTips
Jennifer Dawes
Apr 22, 20252 min read

Tableau Tiny Tip Tuesday
How do we change date sort order to align fiscal calendars? There are a few ways to go about this, take a look to find out.
Jennifer Dawes
Mar 25, 20251 min read


From Distraction to Discovery: How Data Viz Helped Me See ADHD as My Superpower
Embracing my neurodivergence transformed my career—what once felt like a struggle is now my superpower in data visualization.
Jennifer Dawes
Feb 24, 20254 min read


From Dream to Reality: Becoming a 2025 Tableau Visionary
This might sound cheesy, but this is such an emotional one for me— Tableau Visionary!? When I first started learning Tableau, I was...
Jennifer Dawes
Feb 14, 20253 min read
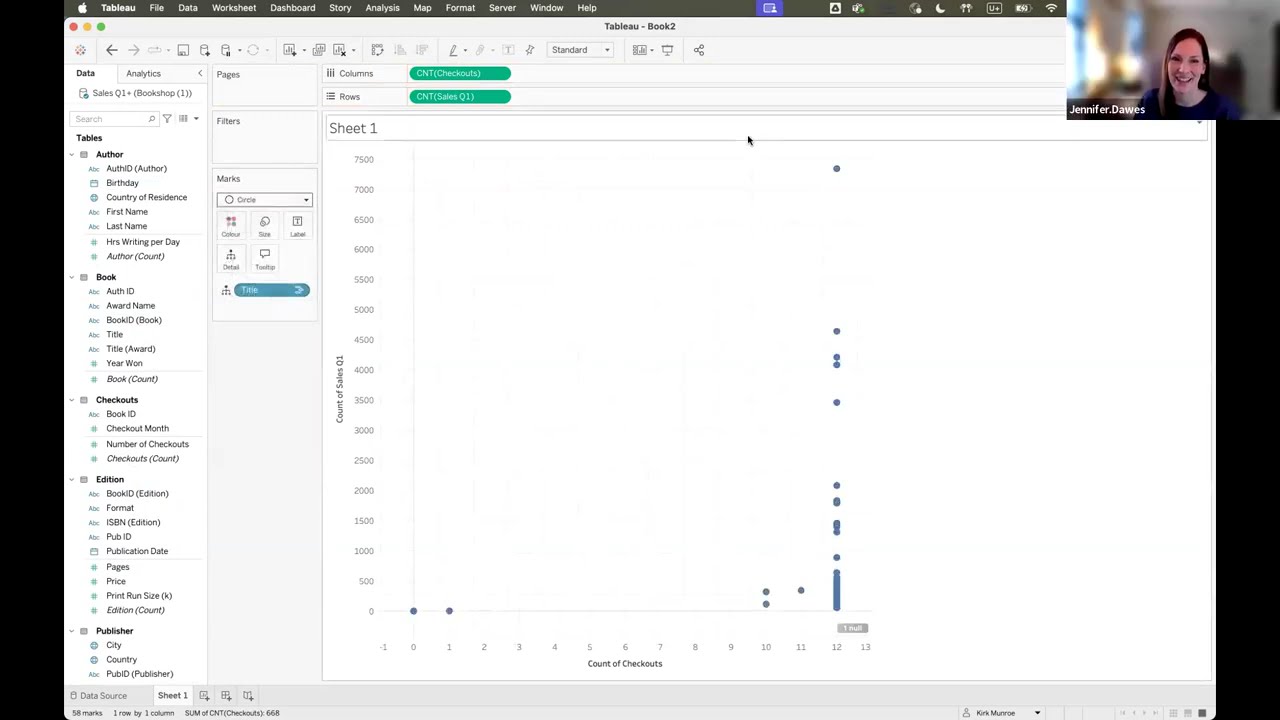
Tableau Relationships with Kirk Munroe and Jennifer Dawes
Tableau relationships simplify analysis, unlock insights, and improve performance—experiment with example datasets before wide adoption!
Jennifer Dawes
Jan 16, 20252 min read


Iron Viz and Analytic Vizion
Jennifer Dawes & team share Iron Viz journey—support, inspiring VIZs, and lessons learned!
Jennifer Dawes
Jan 16, 20241 min read


HER DATA LEARNS: TABLEAU RELATIONSHIPS
Jacqui Moore wows us with Performance Recording insights! Dive into Relationships vs. Joins & see the difference for yourself.

Her Data
May 22, 20231 min read


HER DATA TALKS: BRITTANY ROSENAU
2023 #IronViz finalist Brittany Rosenau shares her journey, stunning viz 'Spiel des Jahres,' and thoughts on Neil Richards. Follow her story
Her Data
Feb 28, 20231 min read


HER DATA LEARNS: MAP LAYERS AND IRON VIZ
Kimly shows us how to use map layers to elevate Tableau visualizations with ease! Watch her full Her Data Learns video & follow her journey.
Her Data
May 16, 20221 min read
bottom of page