top of page

her data
Empowering and Connecting Women in Data.


Celebrating Five Years of Her Data
As we close out 2025, I’m taking a moment to reflect—not just on this past year, but on the incredible five-year journey that has been Her Data. What began as a simple vision to empower and connect women in data has blossomed into a thriving, vibrant community—a collective force fueled by curiosity, creativity, and courage. If you want to grow your career, yes, it’s important to sharpen your skills—but just as crucial is growing your community. The people you surround yoursel

Jennifer Dawes
Dec 30, 20252 min read


When the Work Goes Quiet - The Unfinished Vizzes
Sometimes the hardest part of creativity isn’t starting — it’s knowing when to pause, when to put a project on the shelf, or even when to walk away. In this post, I share my journey with unfinished work, why I’ve learned to embrace the projects that never quite made it to the finish line, and how “failing forward” has become a crucial part of my creative process. If you’ve got a shelf full of half-done ideas, this one’s for you.

Jennifer Dawes
Dec 10, 20254 min read


Closing Out 2025: A Year of Growth, Gratitude, and New Beginnings
As 2025 comes to a close, I’m feeling incredibly thankful for what has been an unforgettable year — both professionally and personally. This year marked some career highs for me: I was honored to place in the top 10 at Iron Viz, and even more humbling, I was named both a 2025 Tableau Ambassador and a Tableau Visionary. These milestones are a testament to the power of passion, persistence, and community. On a more personal note, 2025 brought a significant shift in focus — my h

Jennifer Dawes
Nov 26, 20252 min read


From Blank Page to Iron Viz Stage: Your Invitation to Create
Jennifer encourages the Tableau community to jump into Iron Viz, reminding everyone that every finalist and winner started with a blank page. Whether you’re still brainstorming or just opening Superstore, it’s not too late — great ideas can grow from simple inspiration. Enjoy the process and believe in yourself.

Jennifer Dawes
Oct 29, 20252 min read


Viz in Process - Geometric Animation - Step 4
Continuing my #VizinProcess! 🎨 Added more data and experimenting with a dual axis to capture movement in my Geometric Animation. Still messy, still fun—ideas welcome!

Jennifer Dawes
Sep 24, 20251 min read


Viz in Process - Geometric Animation - Step 3
Join me as I build the foundation for a new geometric animation! In this behind-the-scenes update, I’m plotting circles, tweaking spacing, and experimenting with time and color layers to bring motion to life. It’s messy, fun, and full of happy mistakes—watch how the data evolves from rough dots to a dynamic design.

Jennifer Dawes
Sep 23, 20251 min read


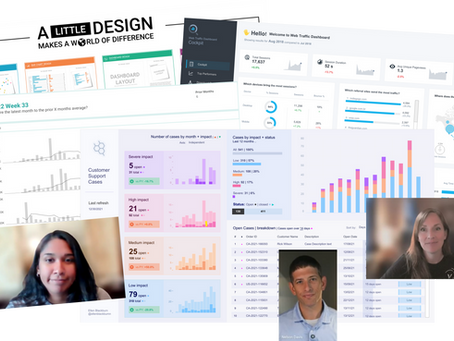
The Anatomy of a Great Business Dashboards
A recent conversation among data-visualization practitioners kept returning to two themes that define every great dashboard: purpose and...

Her Data
Sep 16, 20256 min read


Viz in Process - Geometric Animation - Step 2
In this stage of my project, I’m shifting focus to the data behind the design. The shapes and colors I want to create in Tableau depend on how the data is structured—how many points or shapes are needed, and how they connect. It’s like solving a puzzle where each data choice unlocks a new creative possibility.

Jennifer Dawes
Aug 29, 20251 min read


Practicing in Public: My Journey with Makeover Monday
Makeover Monday is more than a weekly data challenge—it’s a chance to practice, grow, and be part of a supportive community. In this post, I reflect on my journey from early vizzes to today, highlight the growth I can see in my Tableau Public profile, and introduce my new video series: Watch Me – Makeover Monday.

Jennifer Dawes
Aug 28, 20252 min read


Viz in Process - Geometric Animation - Step 1
I take an artistic approach to Tableau, seeing each new sheet as a blank canvas. Inspired by visuals I found on Pinterest, I’m experimenting with recreating shapes and colors in Tableau. How many shapes would you need to build this? What would be your first step in tackling a project like this? Let’s explore the creative process together.

Jennifer Dawes
Aug 27, 20251 min read
bottom of page