Viz in Process - Geometric Animation - Step 1
- Jennifer Dawes

- Aug 27, 2025
- 1 min read
I take an artistic look at Tableau. A new sheet feels like a blank canvas to me. When I see art, I often wonder: Could I create that in Tableau? And just as importantly: What would the data need to look like to make it possible?
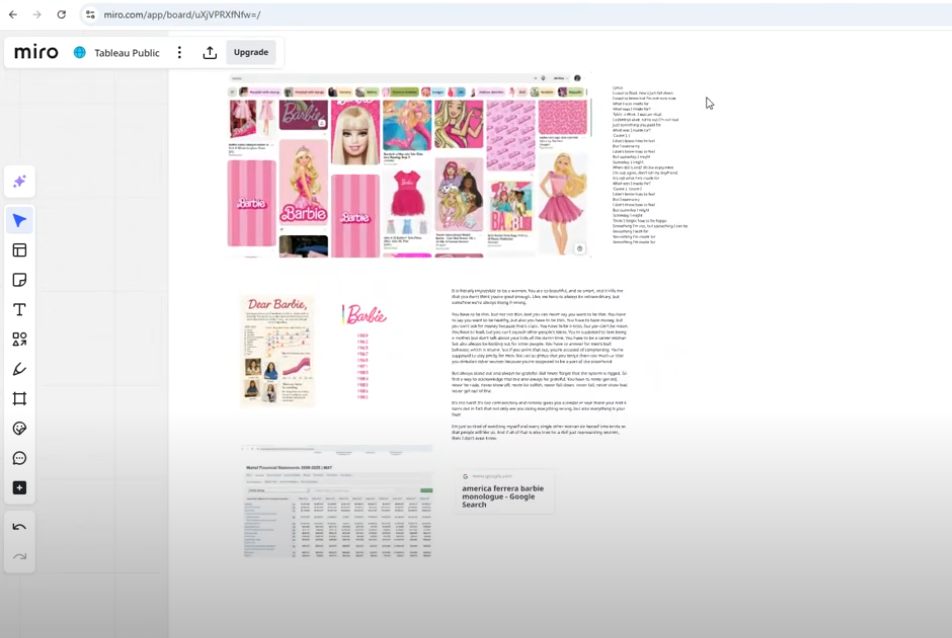
Hi everyone! I’m excited to share that I’m starting a new project inspired by some visuals I discovered on Pinterest. My goal is to experiment with recreating these shapes and colors in Tableau, exploring how data can drive design in ways that go beyond traditional charts and graphs.
I’d love for you to think along with me—how many shapes do you think I’d need to build this out? What would be your first step in approaching a project like this? How would you structure the data to make it work?
This is as much about the process as it is about the final visualization. I’m curious to see how others would tackle the challenge, and I hope we can explore this creative process together!


Comments