
Viz in Process - Dear Barbie - Step 5 - Shaping the Story
- Jennifer Dawes

- Aug 8, 2025
- 1 min read
Every visualization has a turning point—the moment it stops being just charts and colors and starts becoming a story. Step 5 is that moment for my Barbie project.
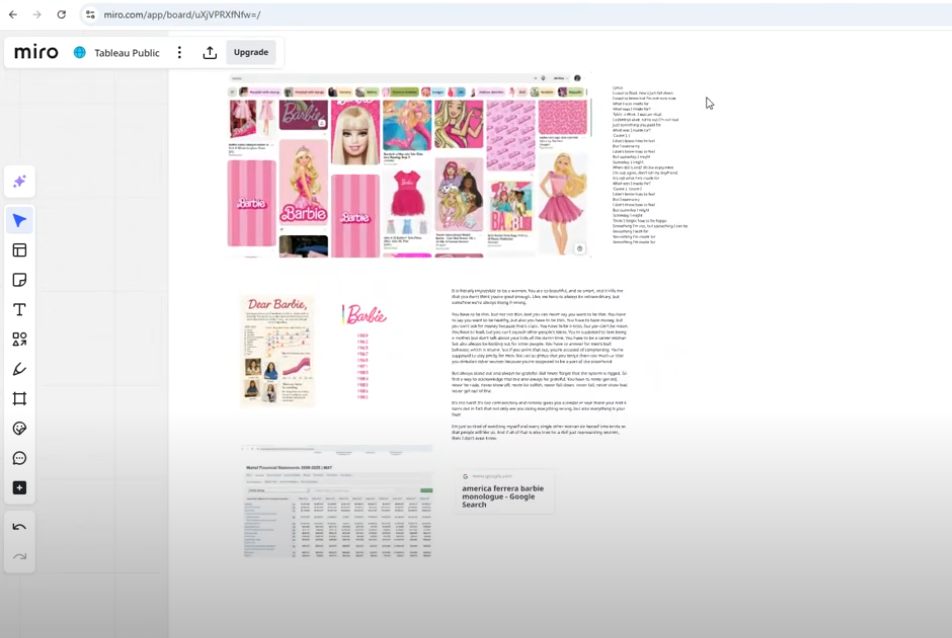
The design is mostly in place now, inspired by those iconic, old-school Barbie boxes that instantly spark nostalgia. With some help from ChatGPT to recreate a few images, I can finally see the full narrative taking shape.
This step is about layering meaning onto the visuals. I’m connecting Barbie’s evolving careers over the decades with real-world data—women’s representation in STEM, wage statistics, and the progress (and gaps) we still see today.
The story isn’t finished yet, but shaping it now helps me see what’s missing, what’s working, and what could be stronger.
Take a look at the visuals so far and let me know—what stands out to you? What would make the story even more compelling?


Comments