top of page

her data
Empowering and Connecting Women in Data.

Her Data talks to the data community to spotlight individuals
Her Data learns from the data community to strengthen skills

Missing Tableau Conference This Year… But Here’s What I’d Tell You If I Were There
I’m a little sad not to be attending Tableau Conference this year. There’s something special about being surrounded by people who all get excited about the same things—data, design, dashboards, and the tiny details most people overlook. It’s energizing in a way that’s hard to explain unless you’ve been there. Since I won’t be there in person, I figured I’d pass along a few of my favorite tips—everything I’ve learned from past conferences that might help you make the most of y

Jennifer Dawes
24 hours ago3 min read


Great Analysts Don’t Start with Data. They Start with Questions.
Great insights don’t come from tools—they come from the questions we ask. This post explores why starting with the right question—not the flashiest dashboard—drives clarity, impact, and better decisions in analytics.
Jennifer Dawes
Mar 314 min read


Celebrating Five Years of Her Data
As we close out 2025, I’m taking a moment to reflect—not just on this past year, but on the incredible five-year journey that has been Her Data. What began as a simple vision to empower and connect women in data has blossomed into a thriving, vibrant community—a collective force fueled by curiosity, creativity, and courage. If you want to grow your career, yes, it’s important to sharpen your skills—but just as crucial is growing your community. The people you surround yoursel
Jennifer Dawes
Dec 30, 20252 min read

When the Work Goes Quiet - The Unfinished Vizzes
Sometimes the hardest part of creativity isn’t starting — it’s knowing when to pause, when to put a project on the shelf, or even when to walk away. In this post, I share my journey with unfinished work, why I’ve learned to embrace the projects that never quite made it to the finish line, and how “failing forward” has become a crucial part of my creative process. If you’ve got a shelf full of half-done ideas, this one’s for you.
Jennifer Dawes
Dec 10, 20254 min read


Closing Out 2025: A Year of Growth, Gratitude, and New Beginnings
As 2025 comes to a close, I’m feeling incredibly thankful for what has been an unforgettable year — both professionally and personally. This year marked some career highs for me: I was honored to place in the top 10 at Iron Viz, and even more humbling, I was named both a 2025 Tableau Ambassador and a Tableau Visionary. These milestones are a testament to the power of passion, persistence, and community. On a more personal note, 2025 brought a significant shift in focus — my h
Jennifer Dawes
Nov 26, 20252 min read

From Blank Page to Iron Viz Stage: Your Invitation to Create
Jennifer encourages the Tableau community to jump into Iron Viz, reminding everyone that every finalist and winner started with a blank page. Whether you’re still brainstorming or just opening Superstore, it’s not too late — great ideas can grow from simple inspiration. Enjoy the process and believe in yourself.
Jennifer Dawes
Oct 29, 20252 min read

Viz in Process - Geometric Animation - Step 4
Continuing my #VizinProcess! 🎨 Added more data and experimenting with a dual axis to capture movement in my Geometric Animation. Still messy, still fun—ideas welcome!
Jennifer Dawes
Sep 24, 20251 min read

Viz in Process - Geometric Animation - Step 3
Join me as I build the foundation for a new geometric animation! In this behind-the-scenes update, I’m plotting circles, tweaking spacing, and experimenting with time and color layers to bring motion to life. It’s messy, fun, and full of happy mistakes—watch how the data evolves from rough dots to a dynamic design.
Jennifer Dawes
Sep 23, 20251 min read


The Anatomy of a Great Business Dashboards
A recent conversation among data-visualization practitioners kept returning to two themes that define every great dashboard: purpose and...

Her Data
Sep 16, 20256 min read


Viz in Process - Geometric Animation - Step 2
In this stage of my project, I’m shifting focus to the data behind the design. The shapes and colors I want to create in Tableau depend on how the data is structured—how many points or shapes are needed, and how they connect. It’s like solving a puzzle where each data choice unlocks a new creative possibility.
Jennifer Dawes
Aug 29, 20251 min read


Practicing in Public: My Journey with Makeover Monday
Makeover Monday is more than a weekly data challenge—it’s a chance to practice, grow, and be part of a supportive community. In this post, I reflect on my journey from early vizzes to today, highlight the growth I can see in my Tableau Public profile, and introduce my new video series: Watch Me – Makeover Monday.
Jennifer Dawes
Aug 28, 20252 min read
Viz in Process - Geometric Animation - Step 1
I take an artistic approach to Tableau, seeing each new sheet as a blank canvas. Inspired by visuals I found on Pinterest, I’m experimenting with recreating shapes and colors in Tableau. How many shapes would you need to build this? What would be your first step in tackling a project like this? Let’s explore the creative process together.
Jennifer Dawes
Aug 27, 20251 min read


Libby: Where Books Meet a Data Nerd
Data and reading might seem like an unlikely pair, but with Libby and a little help from Tableau, I’ve found a way to bring them together. In this post, I share a few of my favorite tips for getting the most out of Libby—and how I’m using a dashboard to track my own reading journey while connecting with the book-loving community.
Jennifer Dawes
Aug 20, 20254 min read

Viz in Process - Dear Barbie - Step 6 - Final Edits
This is the final video in my Viz in Process: Dear Barbie series! I’m working through the last tweaks and edits to make sure the story is consistent and flows smoothly. The layout takes some time — everything is floating in Tableau!
Jennifer Dawes
Aug 14, 20251 min read


Viz in Process - Dear Barbie - Step 5 - Shaping the Story
Every visualization has a turning point—the moment it stops being just charts and colors and starts becoming a story. Step 5 is that...
Jennifer Dawes
Aug 8, 20251 min read


Viz in Process - Dear Barbie - Step 4 - Shaping the Design
In Step 4 of 'Viz in Process,' we dive into shaping the design—turning ideas into layout, refining the look and feel, and making intentional choices to guide your audience through the story.
Jennifer Dawes
Aug 6, 20251 min read


Viz in Process - Dear Barbie - Step 3 - Start Creating
This is the part where everything starts to move. I’ve stared at the Miro board long enough, now it’s time to actually build.
I open Tableau, drag something onto the canvas, and just start. But that’s the magic—testing, tweaking, undoing, redoing.
This step is where my idea starts to look like something—and that’s when it gets exciting.
Jennifer Dawes
Aug 1, 20251 min read


Viz in Process - Dear Barbie - Step 2 - Miro
Once the chaos settles a bit, I pull everything into Miro. I'm a visual thinker, so seeing ideas, notes, and sketches in one place actually helps me breathe. Sticky notes, scribbles, color blocks—it’s my version of storyboarding, even if it looks like digital confetti.
Jennifer Dawes
Jul 30, 20251 min read


Viz in Process - Dear Barbie - Step 1 - Inspiration and Story
Some people storyboard. Others wireframe. Me? I stare at my screen, question all my life choices, and then drag a random dimension onto the canvas just to see what happens. Welcome to my version of the creative process—equal parts chaos, caffeine, and curiosity.
Jennifer Dawes
Jul 28, 20251 min read


Drawing with Data: Reclaiming Joy Through Data Art
Lately, I’ve been creating in Tableau not to analyze—but to draw. I started experimenting with polygons, shapes, and layers, recreating patterns I saw in Bauhaus art or on Pinterest. It became a joyful, unexpected outlet. No KPIs, no dashboards—just creativity.
Now I’m turning it into a weekly practice. Each week, I’ll share an image that inspires me and a Tableau piece I created from it. If you’d like to join me.
Jennifer Dawes
Jun 10, 20252 min read


What a Week! Tableau Conference 2025 Recap
Just back from my 4th Tableau Conference—and first as a Tableau Visionary! From unforgettable moments with data legends to dreaming up spicy ideas like Wings & Tips, I'm recapping the highlights, community connections, and ways we can lift more women in data. Missed the Tip Battle? I’ve got the link. Came to our session? Don’t forget the survey! 🧡 #TC25 #DataFam #WomenInData #TableauTips
Jennifer Dawes
Apr 22, 20252 min read


Balance is a Myth: A Realistic Look at Work, Motherhood, and Leadership
Success is about setting boundaries, embracing imperfection, and knowing when to prioritize what truly matters.
Jennifer Dawes
Mar 26, 20253 min read

Tableau Tiny Tip Tuesday
How do we change date sort order to align fiscal calendars? There are a few ways to go about this, take a look to find out.
Jennifer Dawes
Mar 25, 20251 min read


Tableau Tiny Tip Tuesday - Moving Axis Label
A single checkbox can move your x-axis labels to the top of your chart in Tableau!
Jennifer Dawes
Feb 25, 20251 min read


From Distraction to Discovery: How Data Viz Helped Me See ADHD as My Superpower
Embracing my neurodivergence transformed my career—what once felt like a struggle is now my superpower in data visualization.
Jennifer Dawes
Feb 24, 20254 min read


From Dream to Reality: Becoming a 2025 Tableau Visionary
This might sound cheesy, but this is such an emotional one for me— Tableau Visionary!? When I first started learning Tableau, I was...
Jennifer Dawes
Feb 14, 20253 min read
Tableau Tiny Tip Tuesday - Drag and Drop
Boost your Tableau skills with these quick drag-and-drop tips!
Jennifer Dawes
Feb 4, 20251 min read
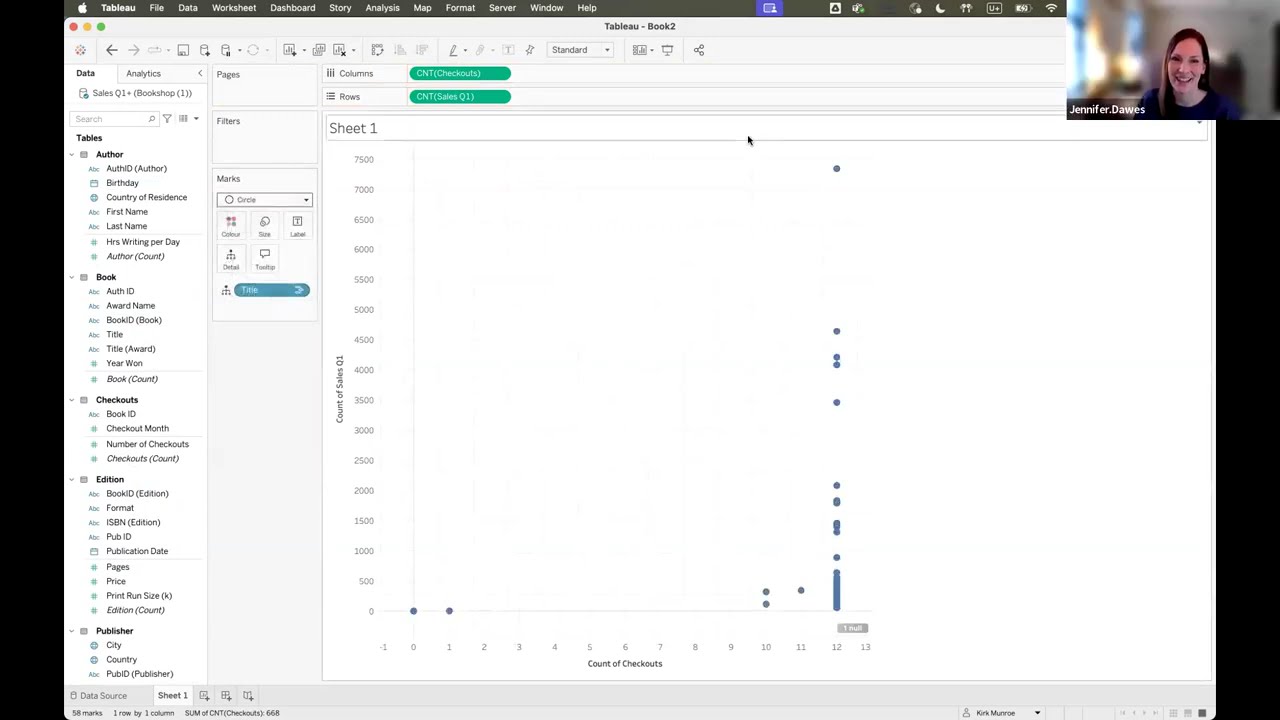
Tableau Relationships with Kirk Munroe and Jennifer Dawes
Tableau relationships simplify analysis, unlock insights, and improve performance—experiment with example datasets before wide adoption!
Jennifer Dawes
Jan 16, 20252 min read


Tableau Relationships - Strengths and Nuances
Discover the strengths and nuances of Tableau Relationships. Learn how to effectively model data and tackle challenges.
Jennifer Dawes
Jan 9, 20251 min read

Analytics Tableau User Group - December 2024
Learn how to build a Data Dictionary using Tableau's metadata API and GraphiQL.
Jennifer Dawes
Dec 18, 20241 min read


Paginated GraphiQL Queries using Python
Bypassing Tableau's 20k node limit: Use Python & Tableau Server Client for efficient metadata queries, pagination, & custom outputs.

Ryan McAnelly
Dec 17, 20244 min read


Who Do You Viz For?
Who do I viz for? Some pieces hit big, others went unnoticed, but each one shaped my journey and growth as a creator.
Jennifer Dawes
Dec 2, 20246 min read
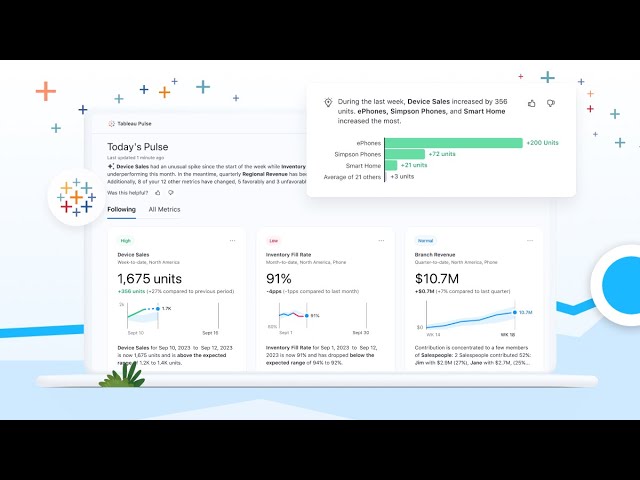
Tableau Pulse Quick Overview
Learn how to create AI-powered metric cards and use its AI questioning to drill deeper into your data.
Jennifer Dawes
Nov 21, 20241 min read
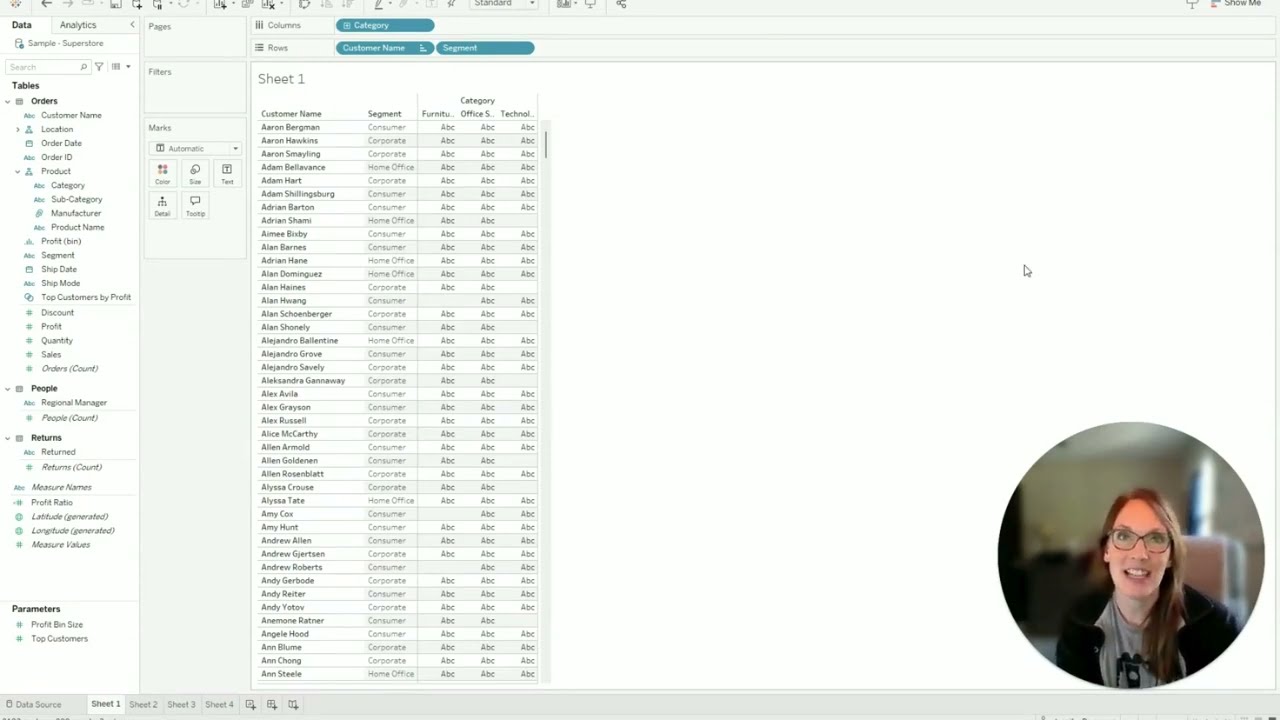
Tableau Tiny Tip Tuesday - Effective Font Formatting
Jennifer shares effective font formatting tip in Tableau.
Jennifer Dawes
Oct 15, 20240 min read


Announcing the Tableau Data Art Gallery: A Celebration of Creative Expression
We’re excited to introduce the Tableau Community Data Art Gallery , a new space dedicated to celebrating the beauty of data visualization...
Jennifer Dawes
Oct 2, 20242 min read

Tableau Tiny Tip Tuesday - Renaming Fields and Aliases
Jennifer shares how to trace fields that have been renamed or aliased.
Jennifer Dawes
Oct 1, 20240 min read
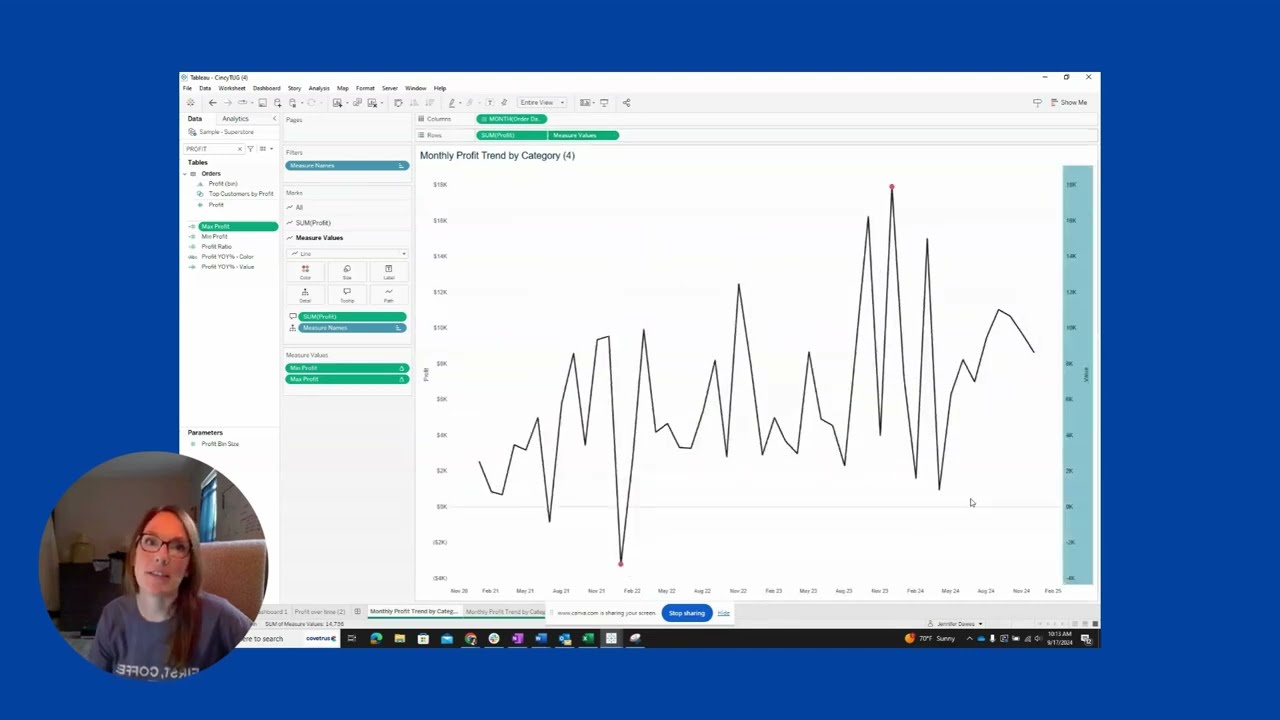
Tableau Tiny Tip Tuesday - Hiding Marks
Jennifer shares ways to highlight min and max marks in a few different ways.
Jennifer Dawes
Sep 17, 20240 min read


Reflecting on My Tableau Iron Viz Journey: Lessons Learned and New Directions
Participating in Tableau's Iron Viz competition has been one of the most exhilarating and transformative experiences of my data...
Jennifer Dawes
Sep 16, 20246 min read
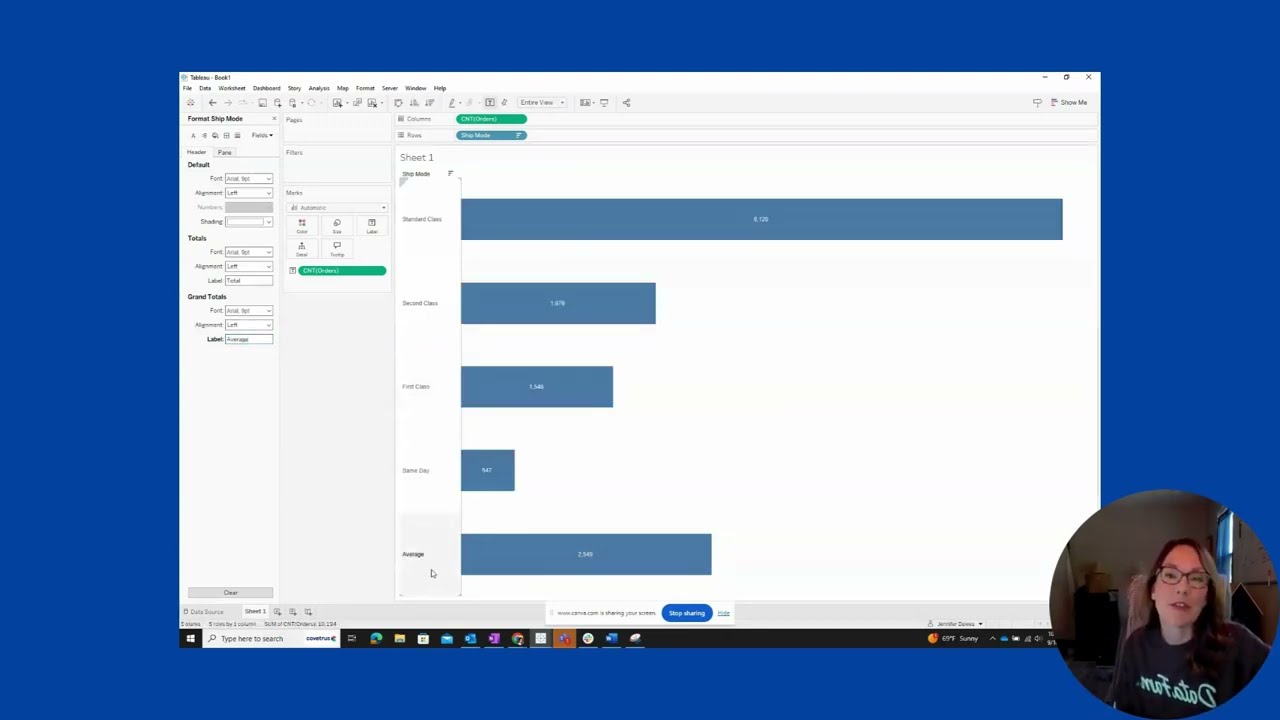
Tableau Tiny Tip Tuesday - Changing aggregation for Grand Totals
Jennifer shares a tip to changing aggregation when using Grand Totals
Jennifer Dawes
Sep 10, 20240 min read


Training Like an Athlete: How I'm Prepping for the Iron Viz Qualifier
For many in the Tableau community, Iron Viz is the pinnacle of data visualization challenges. It’s a test of creativity, technical skill,...
Jennifer Dawes
Sep 6, 20245 min read

Tableau Tiny Tip Tuesday - Using Describe to write calculations
Jennifer shares a Tableau tip she uses everyday
Jennifer Dawes
Aug 27, 20240 min read
Tableau Tiny Tip Tuesday - Using SIGN function in Tableau
Jennifer shares her new favorite Tableau tip.
Jennifer Dawes
Aug 27, 20240 min read


THE MAKING OF GLEE
In this post I am talking about one of my favorite vizes and recent VOTD, Glee. We all have a different creative process and for me the...
Jennifer Dawes
Aug 21, 20243 min read


The Power of Collaboration in Data Visualization: Why Tableau Thrives on Shared Learning
Collaboration in Tableau boosts skills and innovation by exposing diverse techniques and perspectives, enriching work and community ties.
Jennifer Dawes
Aug 19, 20244 min read


The Art of Feedback in Data Visualization: What Works and What Doesn’t
Introduction In data visualization, feedback is not just an occasional formality but a critical component of the project lifecycle and...
Jennifer Dawes
Aug 15, 20243 min read


Life with Visionaries: How Working with Tableau Elite Shaped My Data Career
Introduction Tools may come and go in the world of data, but the wisdom shared by those who truly excel leaves a lasting impact. I've...
Jennifer Dawes
Aug 13, 20245 min read


A Great Business Intelligence Team Isn't Built with Great Tools Alone
Introduction The allure of advanced Business Intelligence (BI) tools is undeniable in today's data-driven world. Companies invest in...
Jennifer Dawes
Aug 9, 20243 min read


Leveraging AI in Data and Technology: Your Personal Assistant in Data Analysis
Introduction Artificial intelligence (AI) has become a transformative force in today's data-driven world, revolutionizing how we leverage...
Jennifer Dawes
Aug 7, 20242 min read


Data Visualization: Transforming Raw Data into Insightful Stories with Tableau
Introduction As someone who started my career in Human Resources, I never imagined data visualization would become such a pivotal part of...
Jennifer Dawes
Aug 6, 20244 min read


METADATA EXERCISE #3: Data Calculations
You saw the title but then you got nervous... Don't go anywhere we're doing this together! Metadata and GraphiQL Recap If you read,...
Jennifer Dawes
Jul 18, 20243 min read
Her Data presents to the data community to share knowledge
Her Data connects with the data community to build relationships
bottom of page