top of page

her data
Empowering and Connecting Women in Data.


Libby: Where Books Meet a Data Nerd
Data and reading might seem like an unlikely pair, but with Libby and a little help from Tableau, I’ve found a way to bring them together. In this post, I share a few of my favorite tips for getting the most out of Libby—and how I’m using a dashboard to track my own reading journey while connecting with the book-loving community.

Jennifer Dawes
Aug 20, 20254 min read


Viz in Process - Dear Barbie - Step 6 - Final Edits
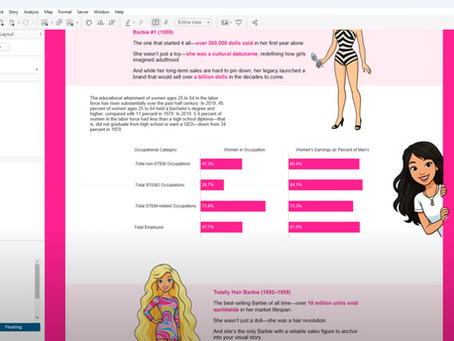
This is the final video in my Viz in Process: Dear Barbie series! I’m working through the last tweaks and edits to make sure the story is consistent and flows smoothly. The layout takes some time — everything is floating in Tableau!

Jennifer Dawes
Aug 14, 20251 min read


Viz in Process - Dear Barbie - Step 5 - Shaping the Story
Every visualization has a turning point—the moment it stops being just charts and colors and starts becoming a story. Step 5 is that...

Jennifer Dawes
Aug 8, 20251 min read


Viz in Process - Dear Barbie - Step 4 - Shaping the Design
In Step 4 of 'Viz in Process,' we dive into shaping the design—turning ideas into layout, refining the look and feel, and making intentional choices to guide your audience through the story.

Jennifer Dawes
Aug 6, 20251 min read


Viz in Process - Dear Barbie - Step 3 - Start Creating
This is the part where everything starts to move. I’ve stared at the Miro board long enough, now it’s time to actually build.
I open Tableau, drag something onto the canvas, and just start. But that’s the magic—testing, tweaking, undoing, redoing.
This step is where my idea starts to look like something—and that’s when it gets exciting.

Jennifer Dawes
Aug 1, 20251 min read


Viz in Process - Dear Barbie - Step 2 - Miro
Once the chaos settles a bit, I pull everything into Miro. I'm a visual thinker, so seeing ideas, notes, and sketches in one place actually helps me breathe. Sticky notes, scribbles, color blocks—it’s my version of storyboarding, even if it looks like digital confetti.

Jennifer Dawes
Jul 30, 20251 min read


Viz in Process - Dear Barbie - Step 1 - Inspiration and Story
Some people storyboard. Others wireframe. Me? I stare at my screen, question all my life choices, and then drag a random dimension onto the canvas just to see what happens. Welcome to my version of the creative process—equal parts chaos, caffeine, and curiosity.

Jennifer Dawes
Jul 28, 20251 min read


Drawing with Data: Reclaiming Joy Through Data Art
Lately, I’ve been creating in Tableau not to analyze—but to draw. I started experimenting with polygons, shapes, and layers, recreating patterns I saw in Bauhaus art or on Pinterest. It became a joyful, unexpected outlet. No KPIs, no dashboards—just creativity.
Now I’m turning it into a weekly practice. Each week, I’ll share an image that inspires me and a Tableau piece I created from it. If you’d like to join me.

Jennifer Dawes
Jun 10, 20252 min read


What a Week! Tableau Conference 2025 Recap
Just back from my 4th Tableau Conference—and first as a Tableau Visionary! From unforgettable moments with data legends to dreaming up spicy ideas like Wings & Tips, I'm recapping the highlights, community connections, and ways we can lift more women in data. Missed the Tip Battle? I’ve got the link. Came to our session? Don’t forget the survey! 🧡 #TC25 #DataFam #WomenInData #TableauTips

Jennifer Dawes
Apr 22, 20252 min read


Balance is a Myth: A Realistic Look at Work, Motherhood, and Leadership
Success is about setting boundaries, embracing imperfection, and knowing when to prioritize what truly matters.

Jennifer Dawes
Mar 26, 20253 min read
bottom of page